

Message Logs
Open Dashboard → Logs to see the full message history for your project.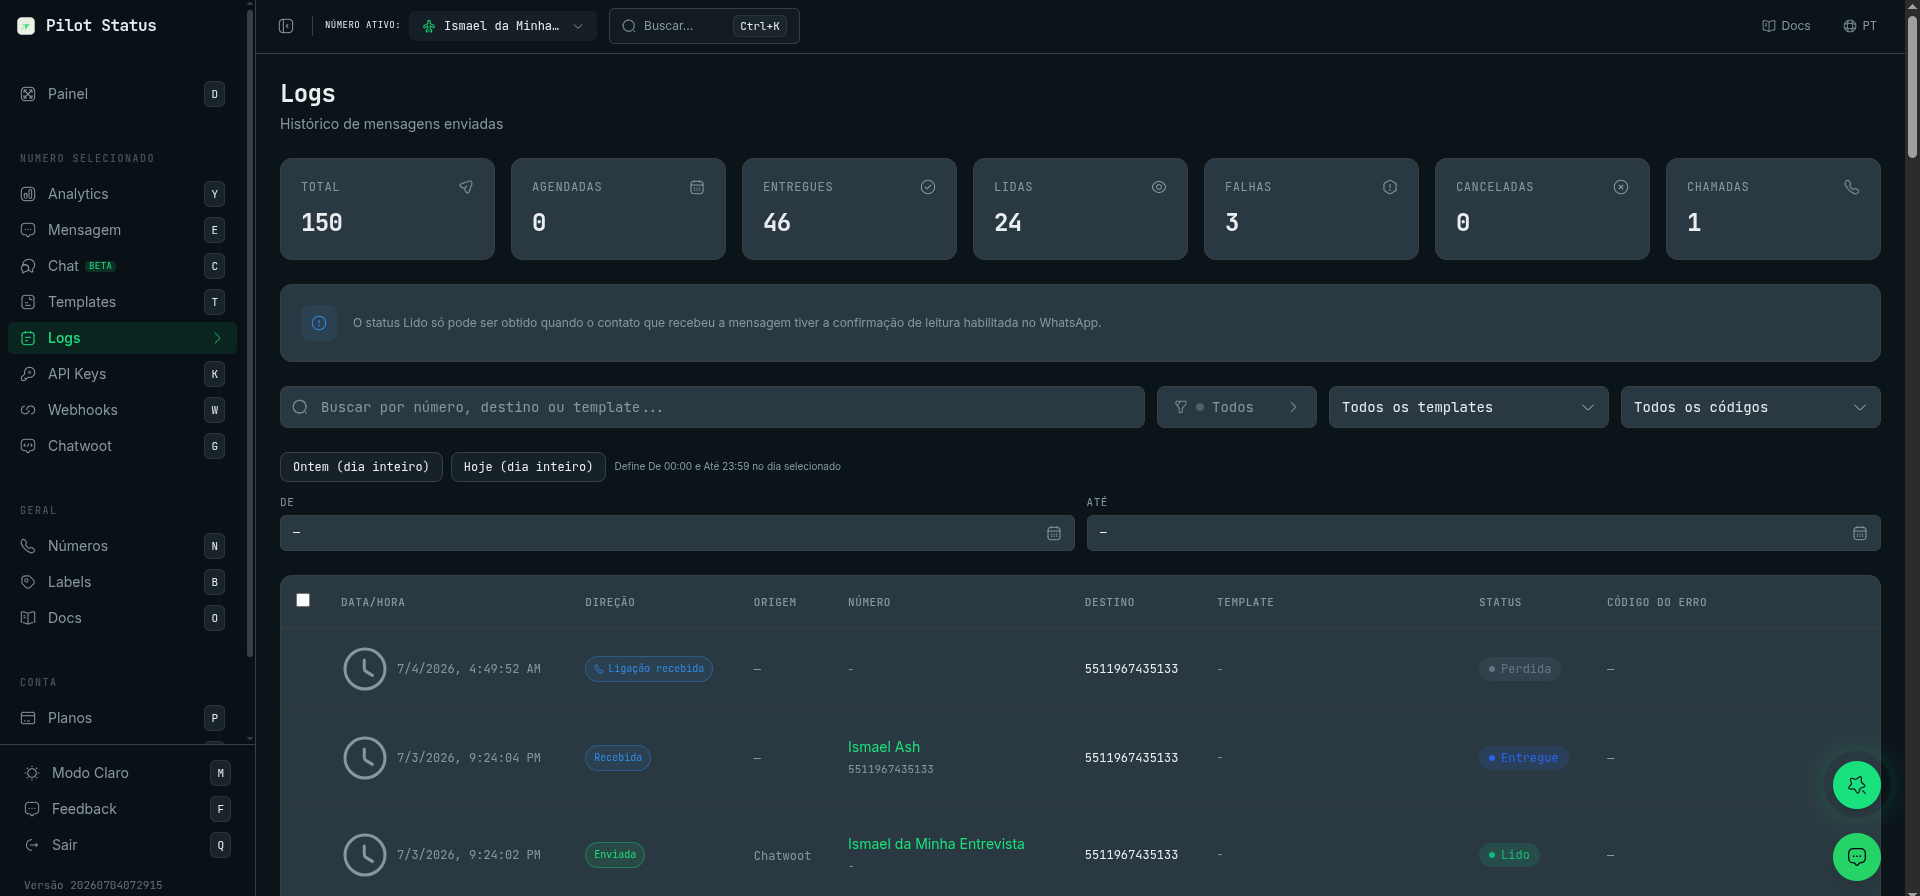
The Logs page — stat cards (total, scheduled, delivered, read, failures, canceled, calls), filters, and the message table.
- Message ID — a unique identifier you can use to correlate log entries with webhook events and API responses.
- Direction — whether the message was inbound (received by your number) or outbound (sent by your system or Live Chat).
- Recipient / Sender — the phone number on the other end of the conversation.
- Content preview — the first characters of the message body, or a media-type label for non-text messages.
- Timestamp — the exact date and time the message was processed by Pilot Status servers.
- Status — the current delivery state of the message (see the table below).
+55 (11) 99999-9999 works) or a template name, and the toolbar filters by status, direction (sent / received / calls), origin (API, Live Chat, Chatwoot, Meta layer, dashboard), template, errors (any error, or a specific error code) and date range — setting only a start or only an end date also works. This makes it straightforward to investigate a delivery issue or retrieve the history for a specific contact.
The Sent direction filter and the status filter show only messages that had a send request. Outbound messages that did not go through Pilot Status’s own sending — origin App, Meta layer, and Chatwoot replies from a native WhatsApp Cloud inbox — do not appear under them. Clear those two filters to see them.
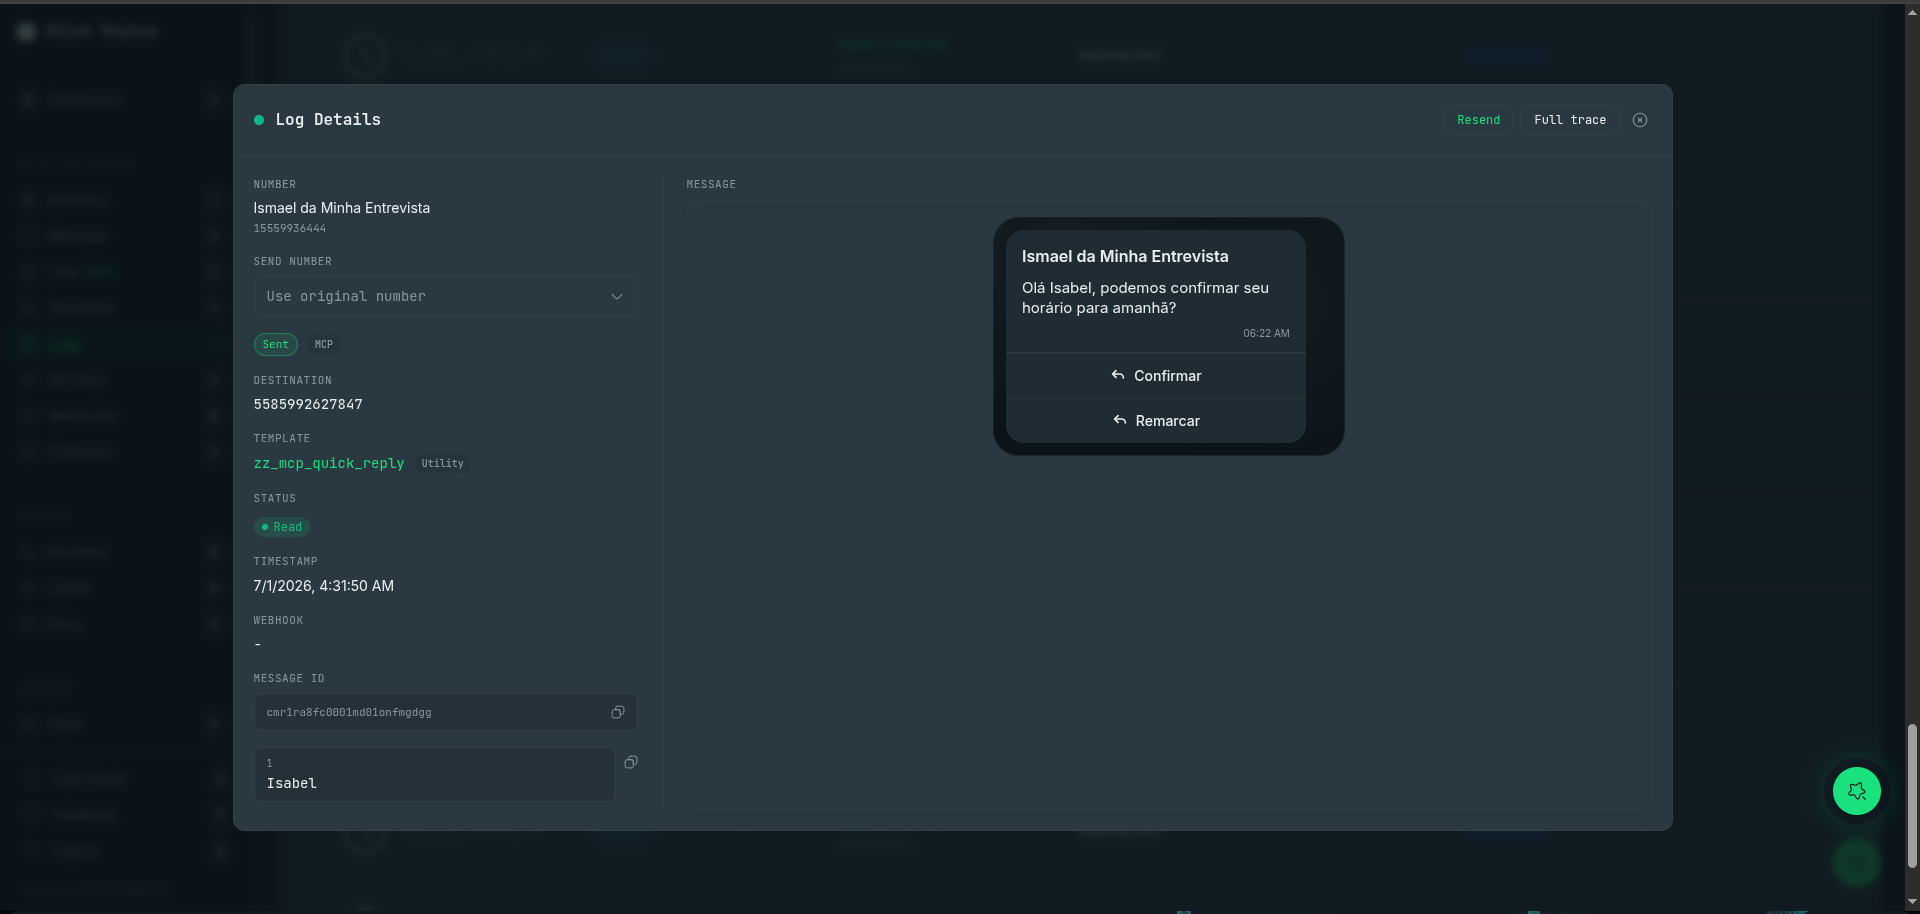
Click any row to open Log Details — rendered message, template, status timeline, message ID, Resend, and Full trace.
Message Status Explained
The 24h service-window badge
Outbound rows also carry a service-window badge: 24h open means the recipient had messaged your number within the previous 24 hours, so the send was treated as a reply and dispatched immediately; 24h closed means it was a cold send (first contact, or the conversation window had expired). Cold sends are intentionally spaced out by the anti-block engine on web-connected numbers, and on official (Meta) numbers they require an approved template. If a message seems to sit in the queue, check this badge first — a closed window explains the pacing. You can also filter the log by window state using the Window filter. Rows sent before this feature was introduced show no badge.Analytics
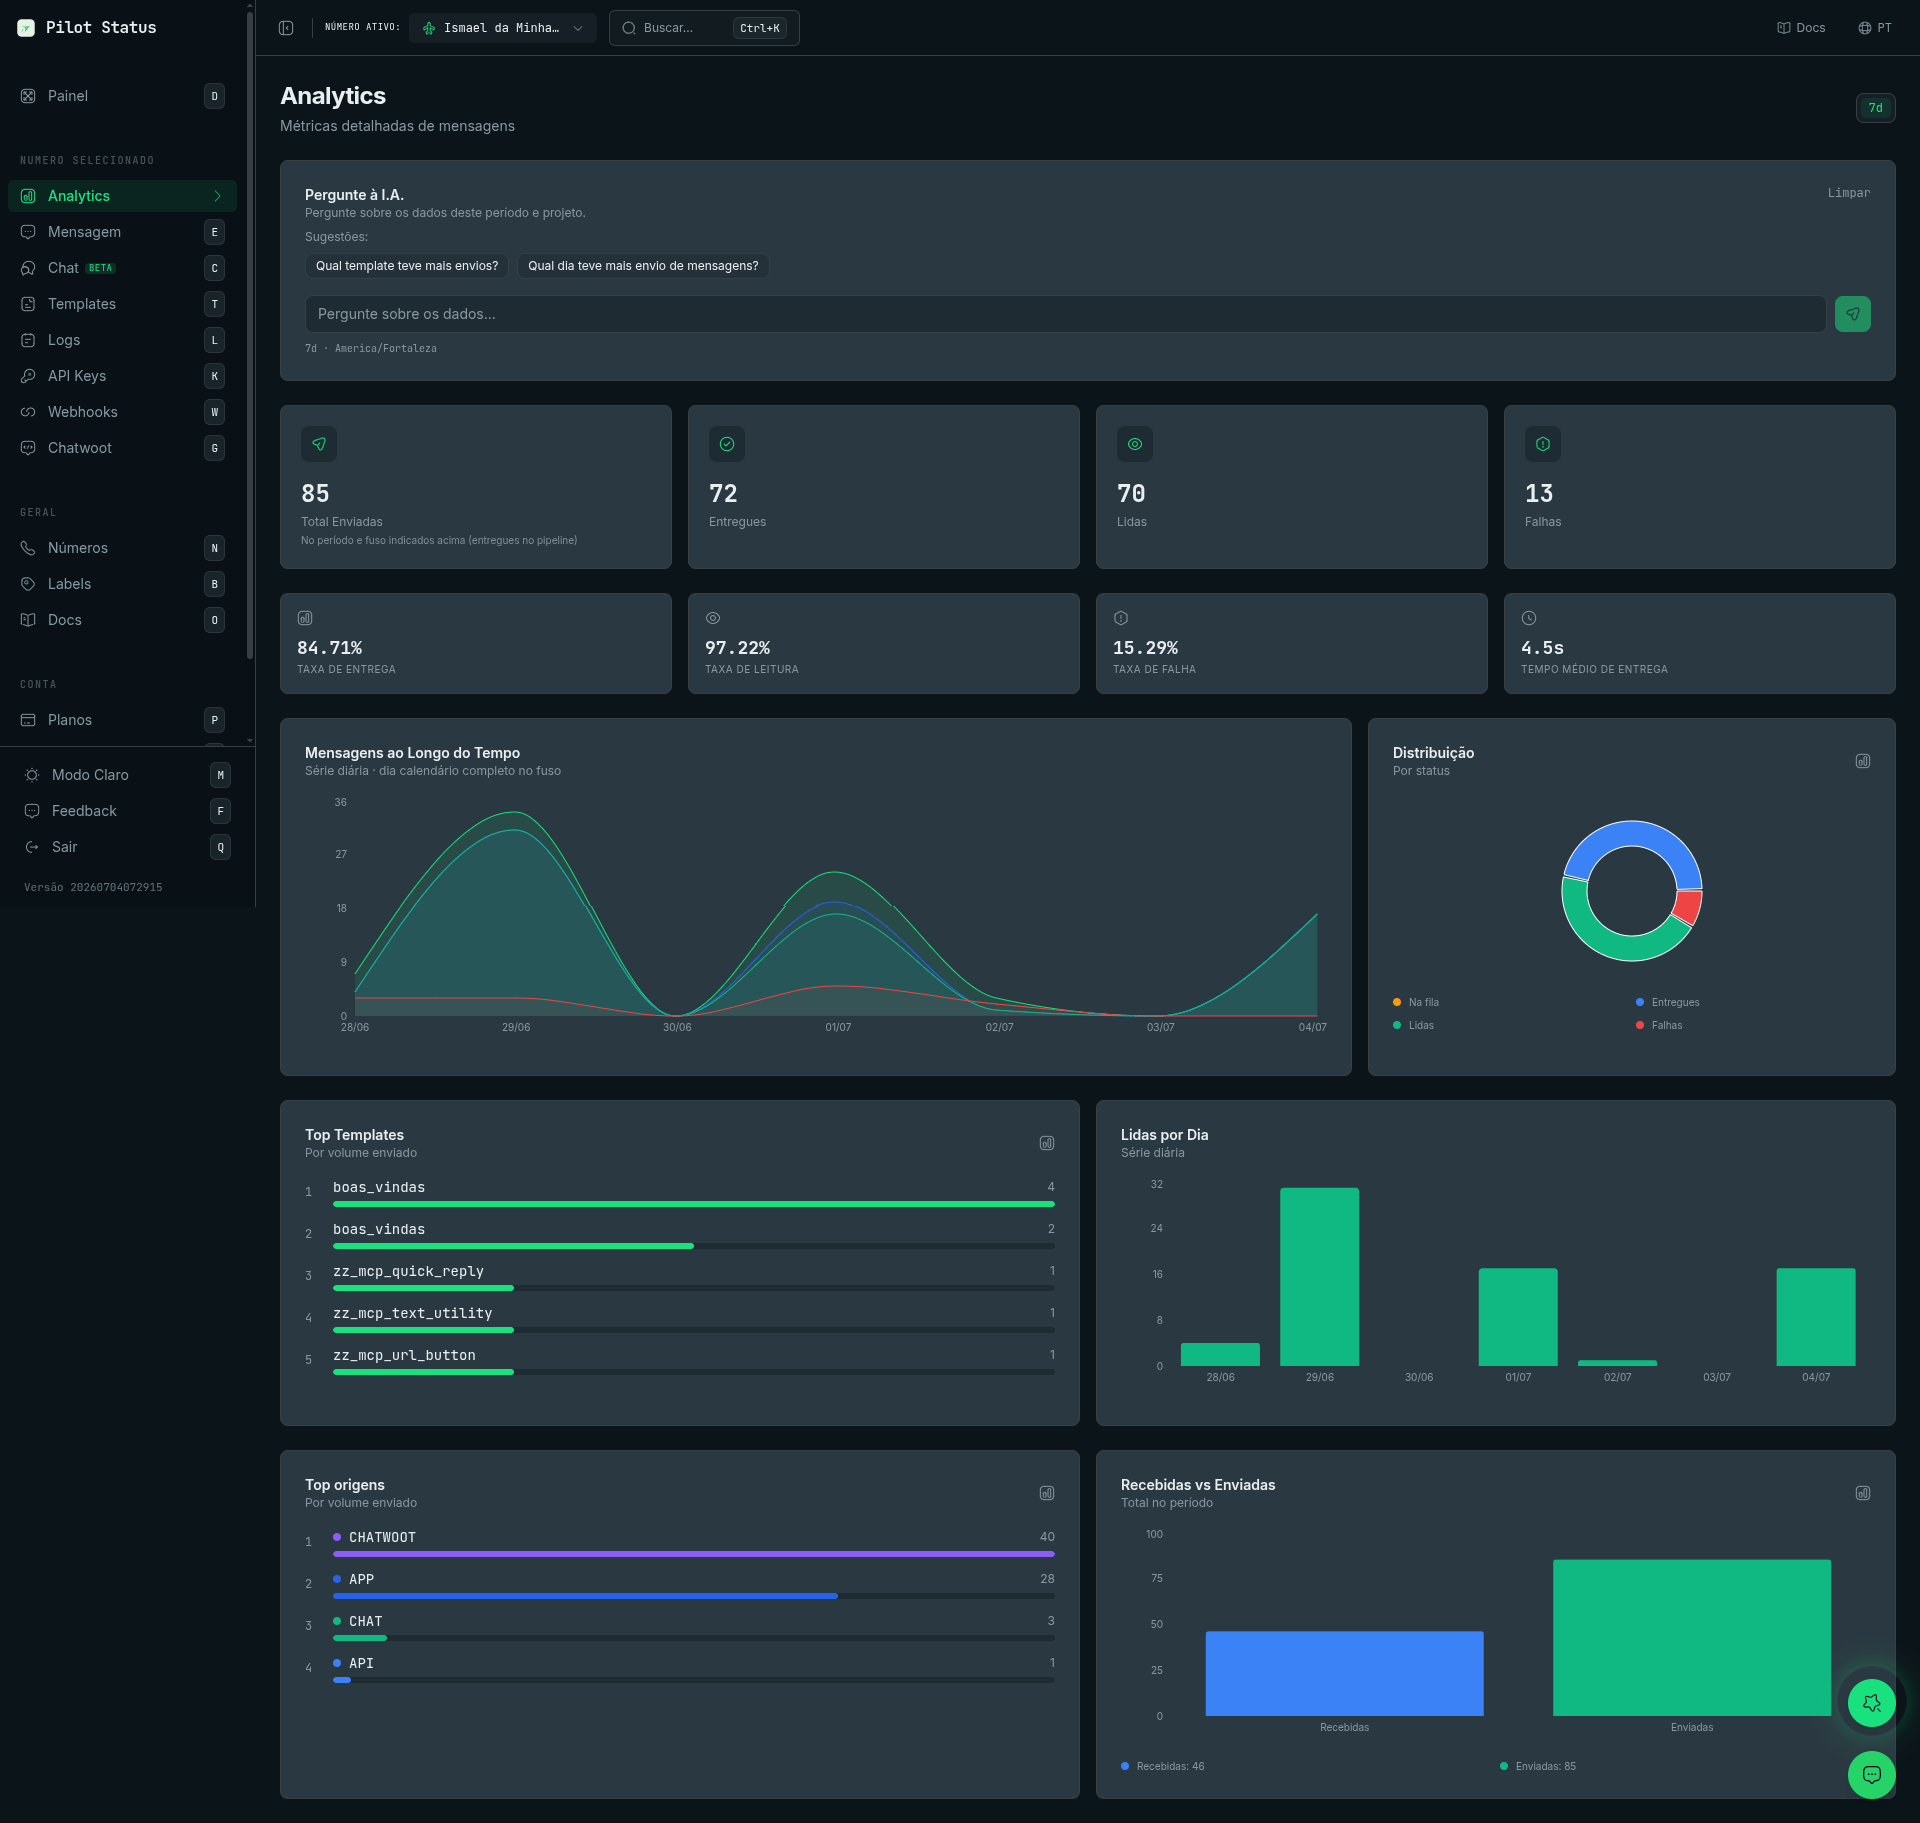
The Analytics page — delivery/read/failure KPIs, a message timeline, top templates and top sources.
- Total messages sent and received over the selected time window.
- Delivery rate — the percentage of sent messages that reached the recipient’s device.
- Read rate — the percentage of delivered messages that were opened by the recipient.
- Messages by number — a breakdown of volume per connected number, useful for spotting which numbers are most active.
- Timeline chart — a chart showing daily message volume over the last 7 days.
Exporting and Auditing Logs
Every message in Pilot Status carries a unique message ID that links the log entry to the corresponding webhook event and API response. This makes it straightforward to trace a message end-to-end across your system — from the API call that triggered it, through the webhook status updates, to the final state in the log. Use the filter and search tools to scope the log view to a specific time period or number, then review entries directly in the dashboard. This is useful for compliance reviews, debugging delivery failures, or auditing campaign performance.Logs are retained for the duration of your subscription. For longer retention options, contact support on WhatsApp: +55 85 98438-7245.